


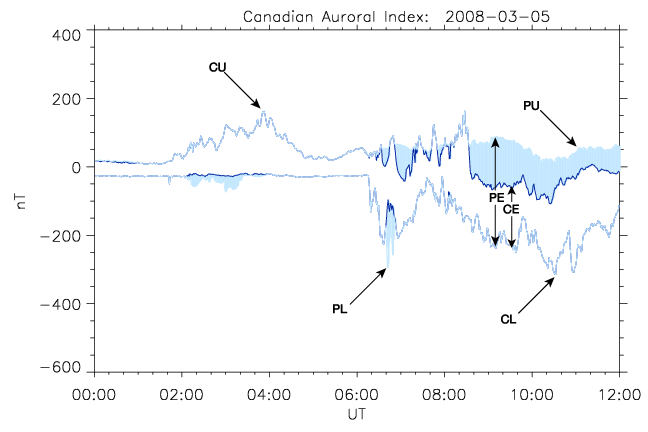
Canadian Auroral Indices
Please select a date to plot.
Understanding the CAE indices
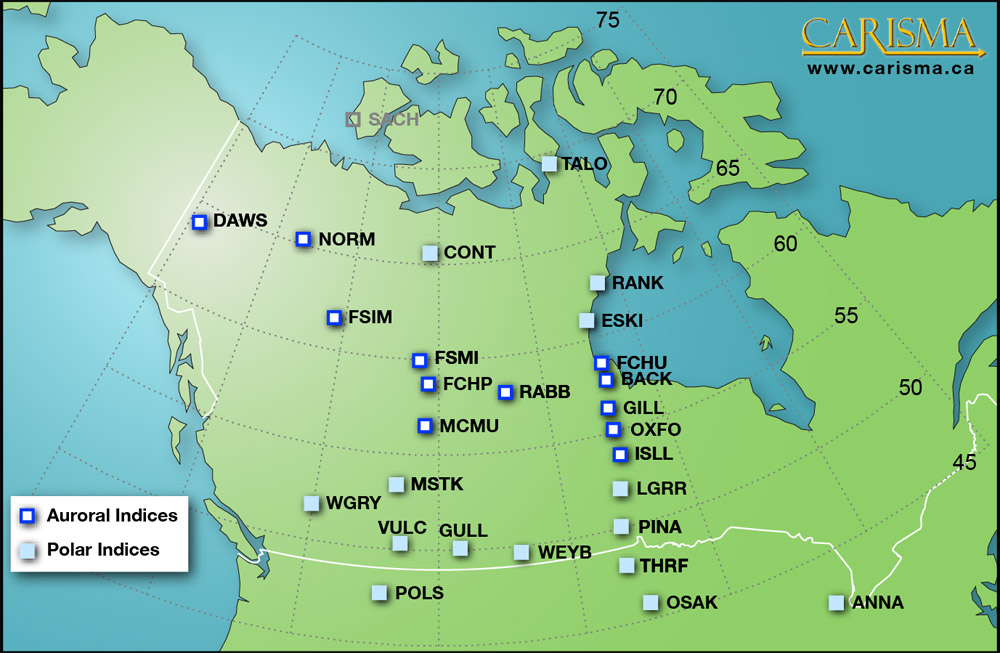
Click the following images to see which sites were used to calculate the indices and what defines the various envelopes.
Please use thumbnails at the bottom of the images to browse.
Plots available from 1 Apr 2005.
CARISMA data use is subject to the Rules of the Road.
